
How to measure ecommerce SEO: a report from category to revenue
 Dmytro Popryadukhin
Short answer. Measure an online shop’s SEO as a chain: category group → organic sessions → orders → revenue. Rankings and overall traffic can’t tell you that. The report should show new and returning buyers separately, because organic search often brings in people who already know the shop. And it should say plainly what it leaves out: returns, phone orders, currency, the attribution model.
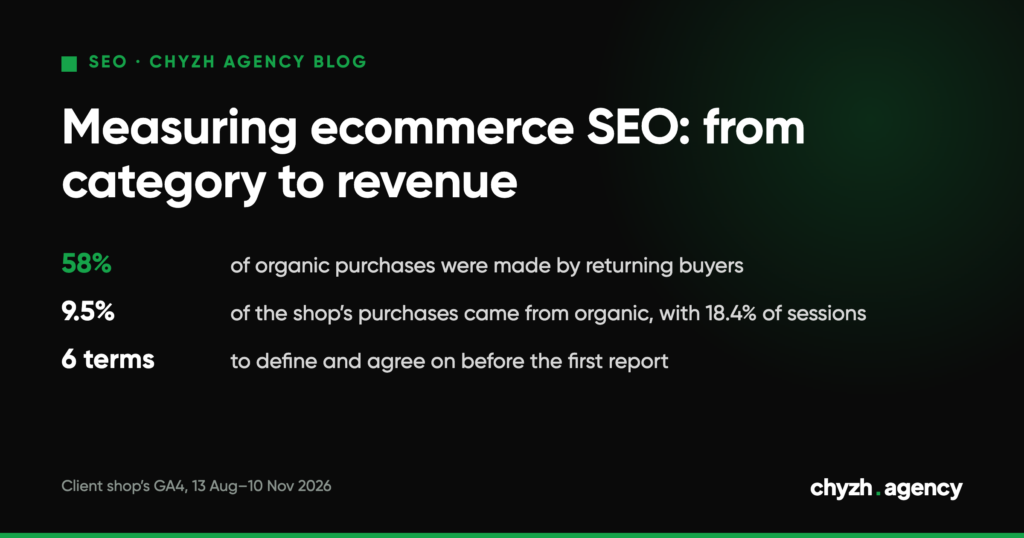
Here’s an example from a water delivery shop we work with. Over 90 days, organic search brought in 18.4% of the shop’s sessions and 9.5% of its purchases. Of those organic purchases, 58% were made by people who had already been on the site.
First, agree on the definitions
| What | How we count it | Why it matters |
|---|---|---|
| Organic | the Organic Search channel in GA4 | in this shop, Organic Shopping (free product listings) and AI Assistant are separate channels, and we don’t mix them in |
| Orders | the purchase event in GA4 |
phone and messenger orders don’t show up here, so we reconcile them with the CRM |
| Revenue | the value from the purchase event, in the shop’s currency (hryvnias) |
GA4 doesn’t subtract returns and cancellations unless they’re sent separately |
| New vs returning | the new/returning users field in GA4 | a returning buyer who searches for the shop by name isn’t something SEO earned |
| Period | a month compared with the same month last year | shops are strongly seasonal, so adjacent months can’t be compared |
| Attribution | the channel of the session in which the purchase happened | the first touch may have come from an ad; that’s a limitation of the model, and nothing is broken |
Without a table like this, two people can look at the same GA4 property and see different numbers.
A monthly report template
| Category group | Organic sessions | Purchases | Conversion rate | Organic share of revenue | New / returning buyers | Same month last year |
|---|---|---|---|---|---|---|
| Category A | ||||||
| Category B | ||||||
| Blog articles | ||||||
| Homepage | ||||||
| Total |
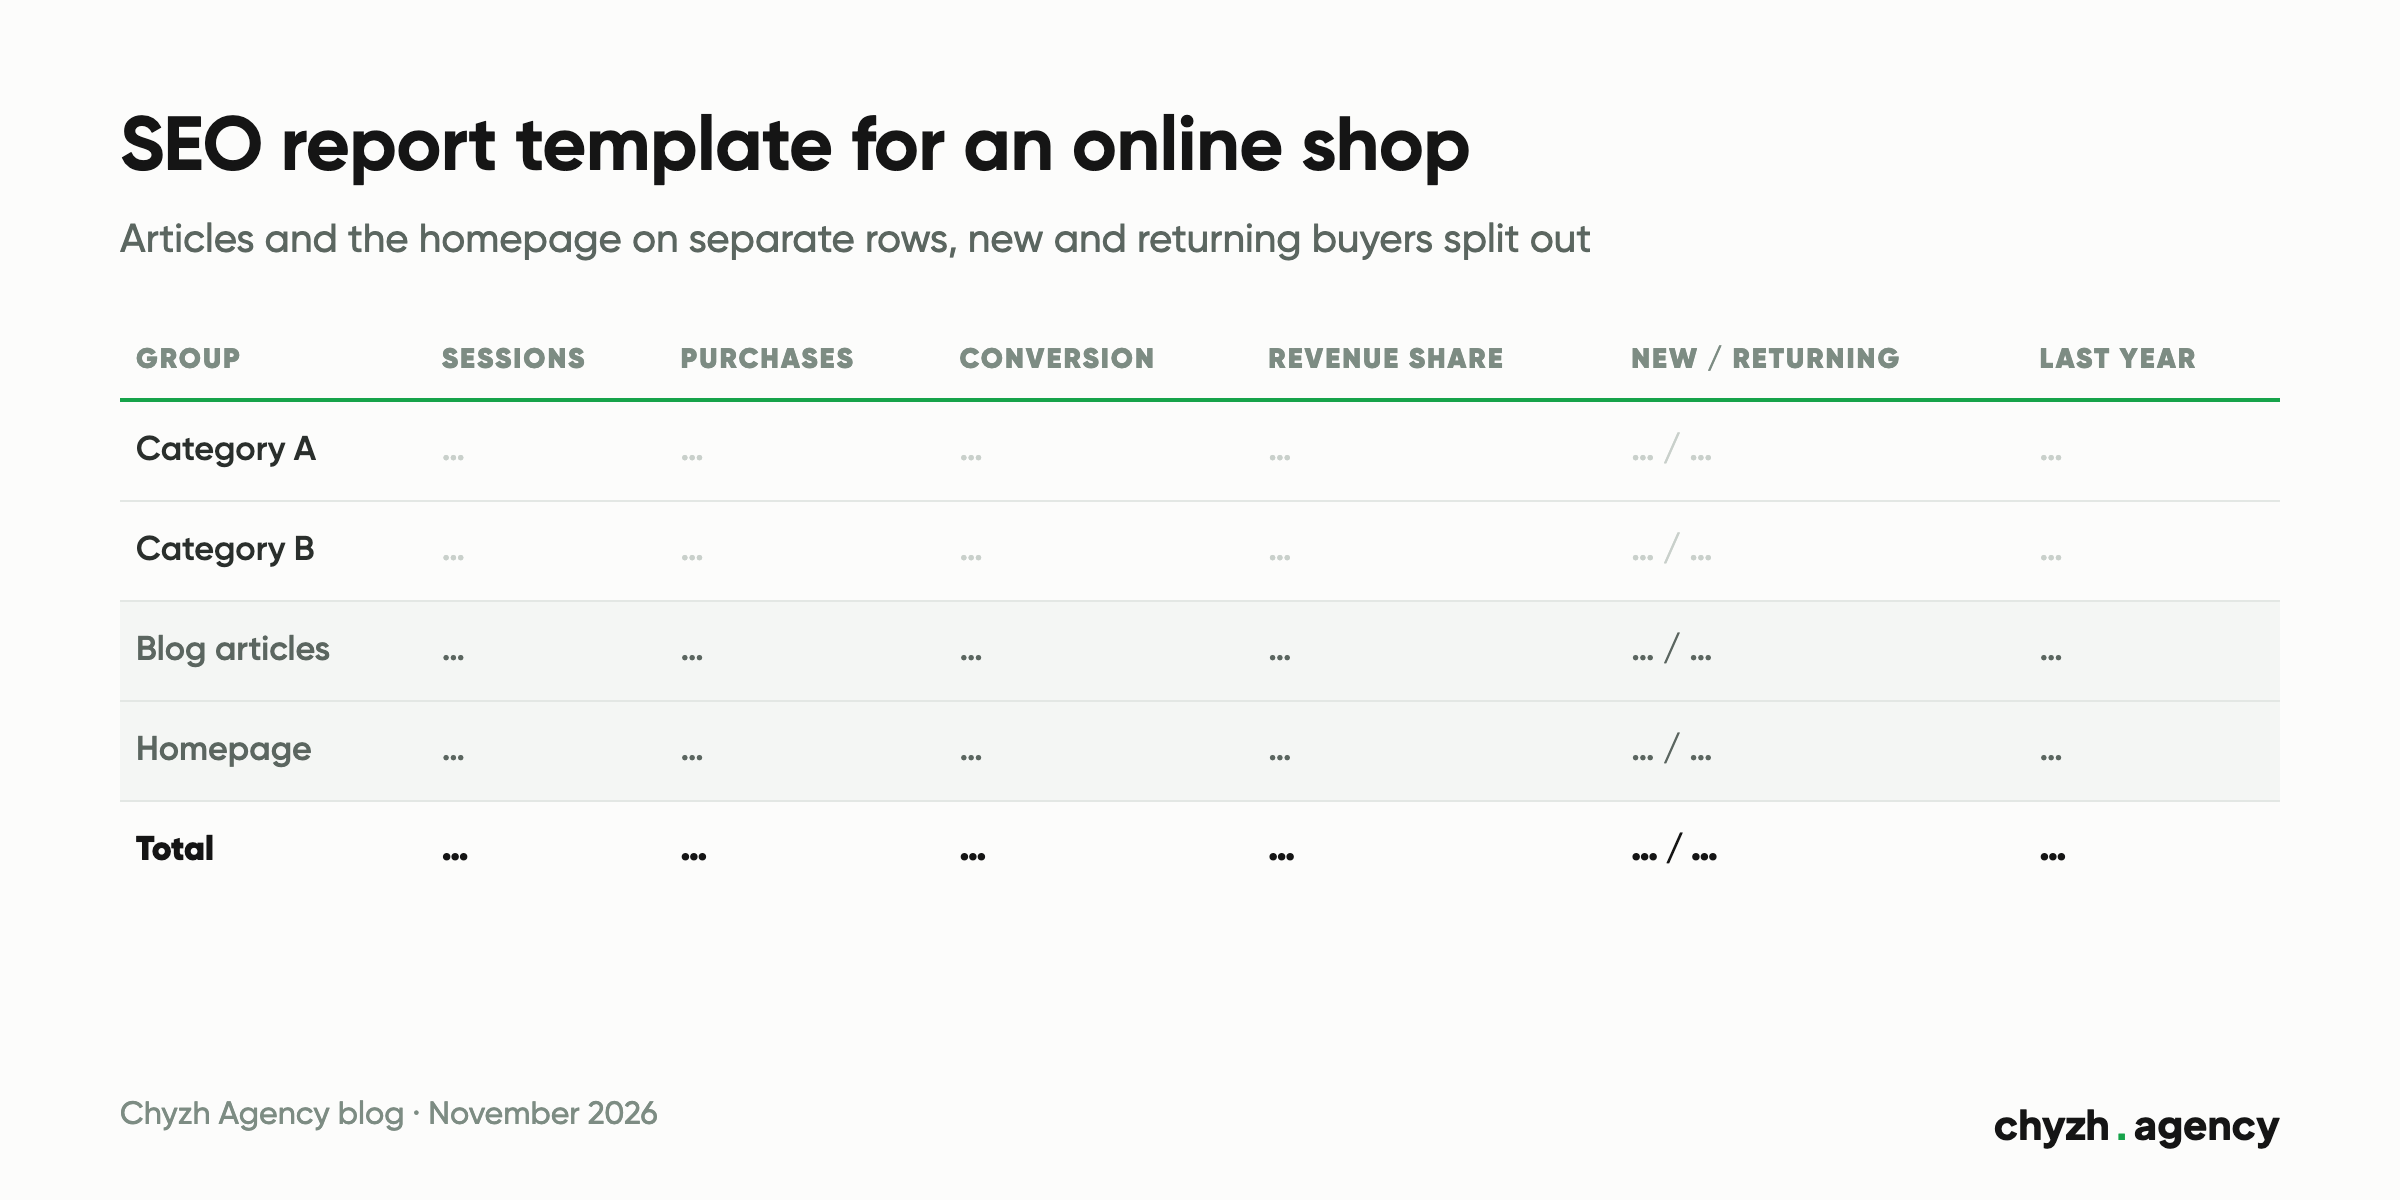
Articles and the homepage get their own rows on purpose. Articles rarely sell directly, and the homepage mostly collects people searching for the shop by name. Merge them with the categories and the report will show growth that the commercial pages don’t have. We looked at how this plays out on real data in our article on traffic without sales.
Example: organic search at a water delivery shop
GA4, 13 August to 10 November 2026. We give shares only, because the shop’s absolute figures aren’t ours to publish.
| Channel | Share of sessions | Share of purchases | Conversion rate |
|---|---|---|---|
| Paid Search | 29.5% | 34.8% | 15.4% |
| Direct | 23.3% | 25.4% | 14.3% |
| Referral | 10.4% | 20.0% | 25.2% |
| Organic Search | 18.4% | 9.5% | 6.7% |
| Cross-network (Google campaigns running across several networks, such as Performance Max) | 16.2% | 8.9% | 7.1% |
| AI Assistant | 0.2% | one purchase |
Organic search isn’t this shop’s main source of sales, and the report has to show that honestly. It mostly brings in people with informational questions: a third of organic sessions land on blog articles.
Returning buyers made 58% of organic purchases, 254 out of 438. New users from organic search buy in 5% of sessions, returning users in 11.6%. For the report, this means splitting organic sales growth into new and returning buyers. Otherwise SEO gets the credit for customers that ads brought in at some point.
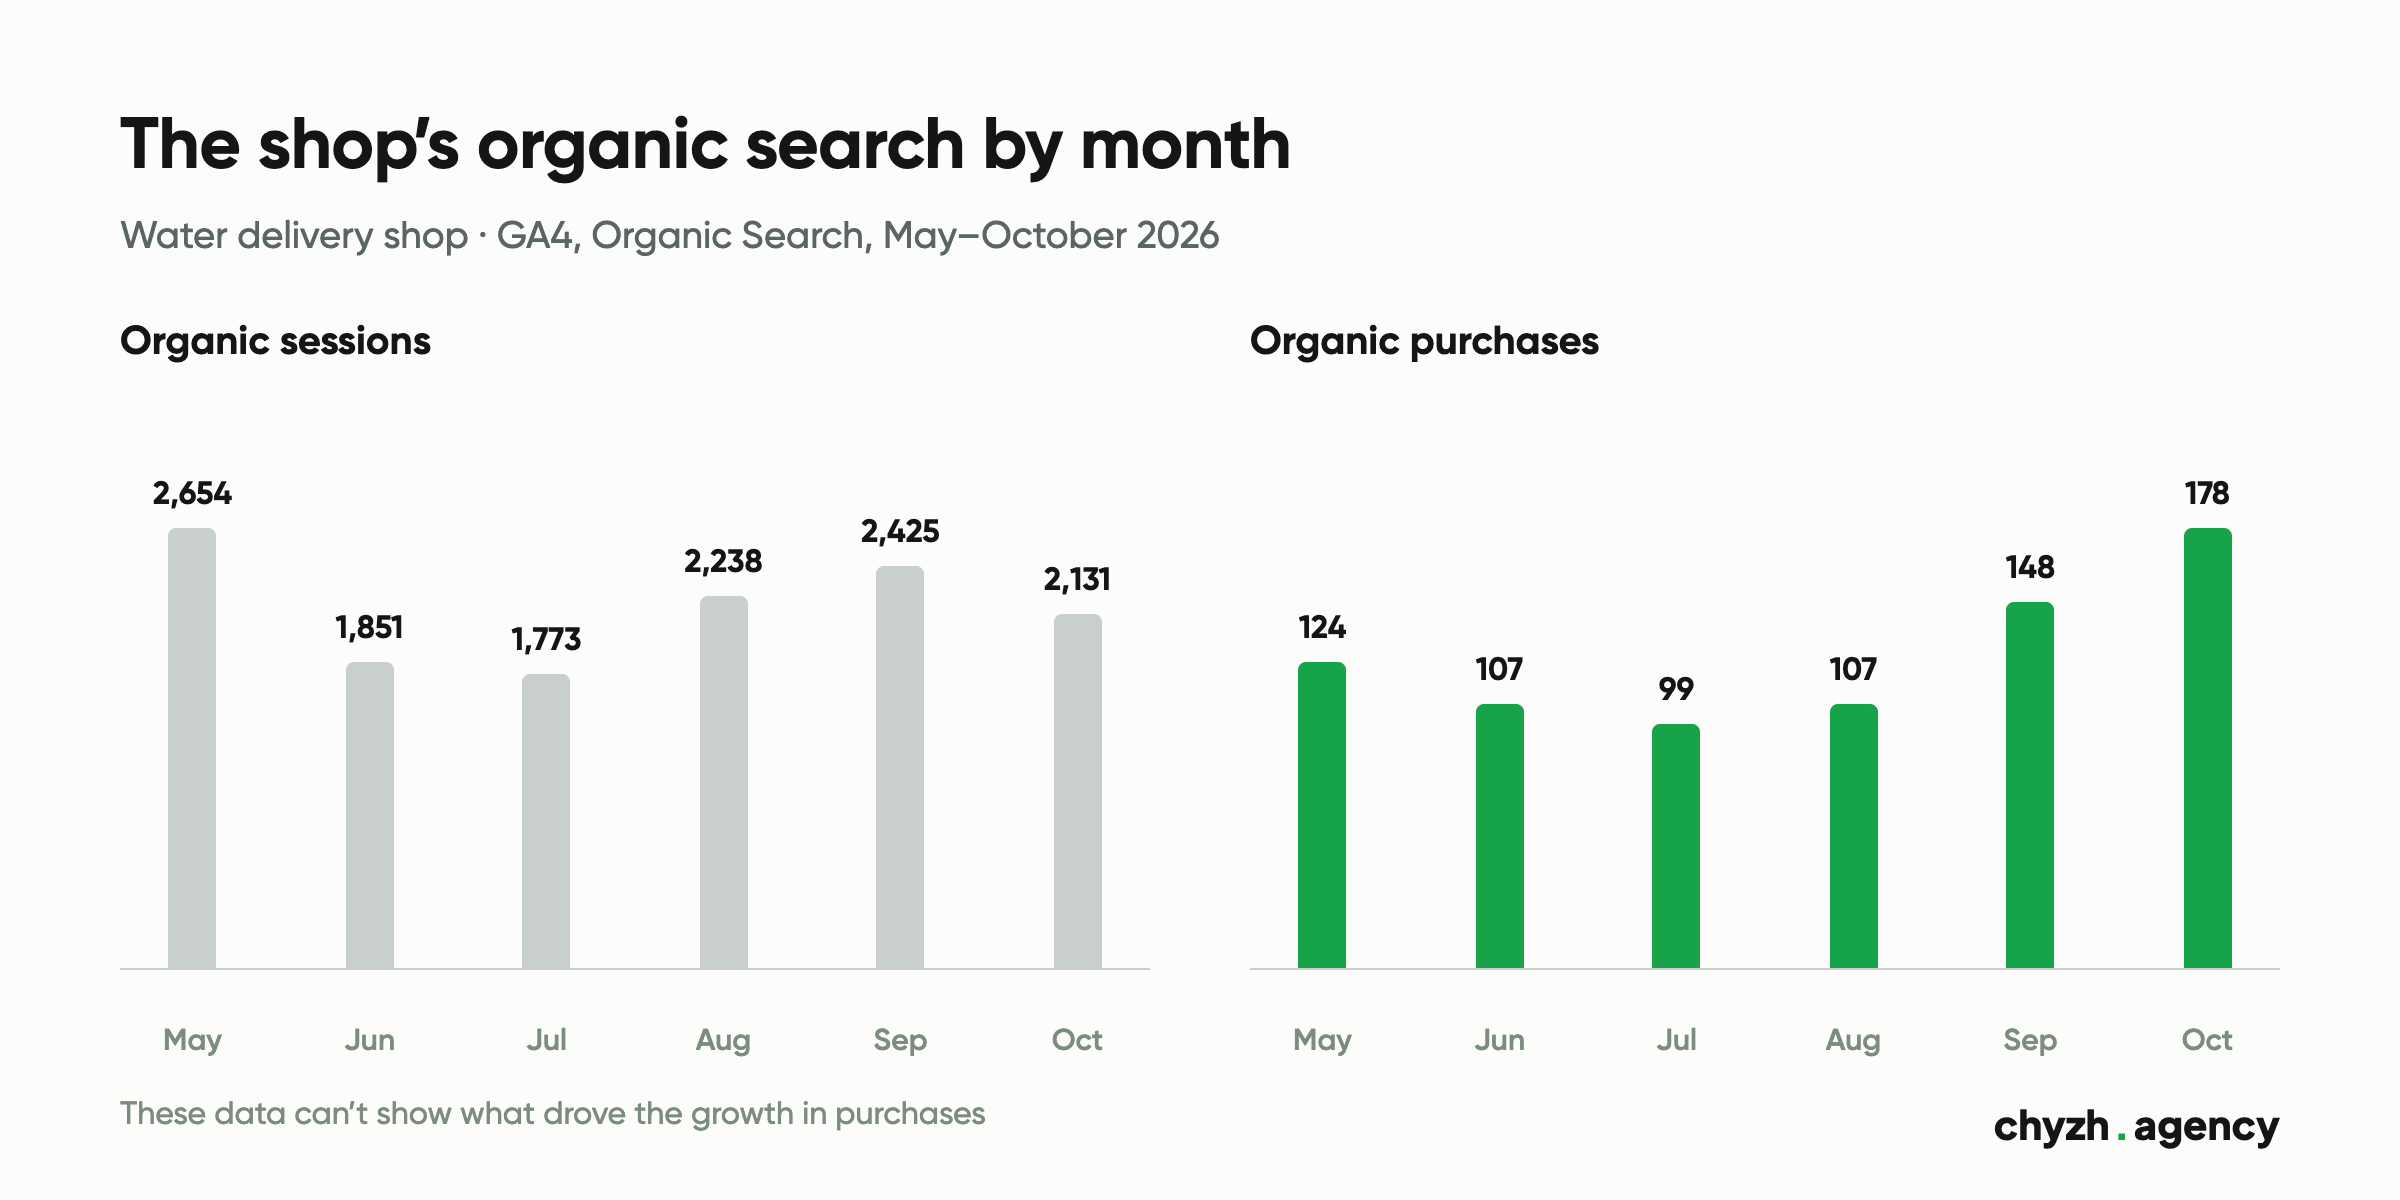
Monthly organic sessions stayed within 1.8–2.7 thousand, while organic purchases rose from 99 in July to 178 in October. These data can’t tell us what drove that growth. The season, promotions and repeat orders are all mixed in. That’s exactly what we write in the report, and we don’t hand all of it to SEO.
What shouldn’t be reported as an SEO result
- rankings without clicks and orders for the same pages;
- total organic sessions with blog articles lumped in;
- revenue that isn’t split into new and returning buyers;
- comparisons with the previous month in a seasonal shop;
- “assisted conversions” with no explanation of how large they are relative to direct ones.
Next step
Start with the definitions table. Agree with your agency on what counts as organic, as an order and as revenue, and how to reconcile it all with the CRM. After that, the first report from the template takes an hour. How we work with a shop’s revenue analytics is described on our ecommerce SEO page.
Author: Dmytro Popryadukhin, Head of SEO at Chyzh Agency. Reviewed by Yevhenii Chyzh, founder.
Sources: the client shop’s GA4, channels and new vs returning users, 13 August–10 November 2026; organic sessions and purchases by month, May–October 2026 (data shown without the shop’s name or revenue figures).
Related articles
A five-step URL Inspection route: status, crawl, canonical, quality. Plus 346 of our own URLs:...
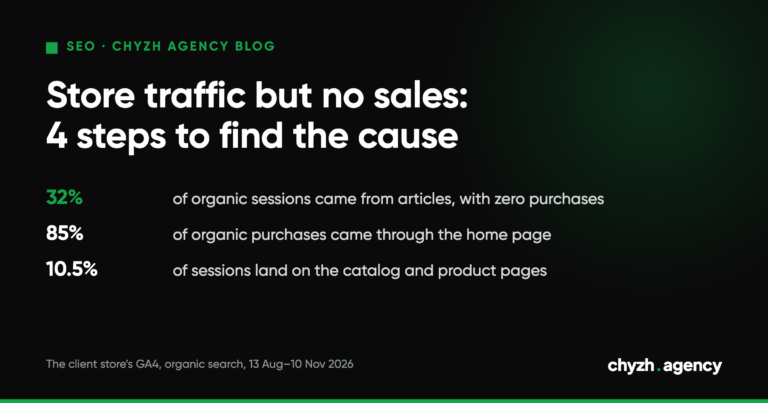
Split organic traffic by landing page. At a real store, articles drove 32% of organic...
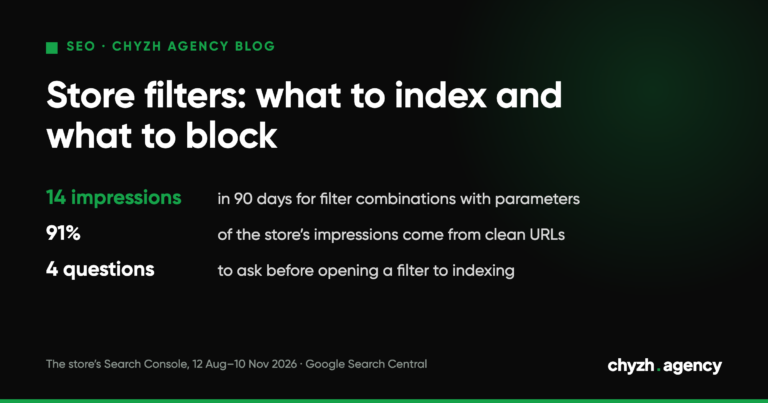
A decision tree for store filters, what Google says about robots.txt and 404s, and real...